Online Appendices for Wolf, Andrew. 2022. “City Power in the Age of Silicon Valley: Evaluating Municipal Regulatory Response to the Entry of Uber to the American City.” City & Community.
Online Appendix 1. Municipal Regulatory Response to TNCs and Driver Protest Data
| City | State | Population | Pre-Uber Regulatory Environment | Regulatory Response | Driver Protests | Month TNC Entered |
| New York | New York | 8,622,698 | Medallion | Strong | Strong | 20 |
| Los Angeles | California | 3,999,759 | Medallion | Strong | Strong | 12 |
| Chicago | Illinois | 2,716,450 | Medallion | Strong | Strong | 6 |
| Houston | Texas | 2,312,717 | Restricted | Strong | Lobby | 35 |
| Philadelphia | Pennsylvania | 1,580,863 | Medallion | Strong | Strong | 43 |
| San Antonio | Texas | 1,511,946 | Restricted | Strong | Strong | 37 |
| San Diego | California | 1,419,516 | Restricted | Weak | Strong | 15 |
| Dallas | Texas | 1,341,075 | Restricted | Strong | Strong | 30 |
| San Jose | California | 1,035,317 | Restricted | Weak | No | 1 |
| Austin | Texas | 950,715 | Restricted | Strong | Strong | 38 |
| Jacksonville | Florida | 892,062 | Medallion | Strong | No | 30 |
| San Francisco | California | 884,363 | Medallion | Strong | Strong | 1 |
| Columbus | Ohio | 879,170 | Restricted | Medium | Lobby | 30 |
| Fort Worth | Texas | 874,168 | Permit | Weak | Strong | 38 |
| Indianapolis | Indiana | 863,002 | Permit | Weak | No | 29 |
| Charlotte | North Carolina | 859,035 | Permit | Weak | No | 30 |
| Seattle | Washington | 724,745 | Restricted | Strong | Strong | 5 |
| Denver | Colorado | 704,621 | Restricted | Weak | Strong | 30 |
| Washington | District of Columbia | 693,972 | Permit | Weak | Strong | 9 |
| Boston | Massachusetts | 685,094 | Medallion | Strong | Strong | 7 |
| El Paso | Texas | 683,577 | Restricted | Weak | No | 39 |
| Detroit | Michigan | 673,104 | Permit | Strong | Strong | 24 |
| Nashville | Tennessee | 667,560 | Restricted | Medium | Strong | 33 |
| Memphis | Tennessee | 652,236 | Restricted | Strong | Lobby | 37 |
| Portland | Oregon | 647,805 | Restricted | Strong | Strong | 45 |
| Oklahoma City | Oklahoma | 643,648 | Restricted | Medium | No | 31 |
| Las Vegas | Nevada | 641,676 | Medallion | Strong | Strong | 43 |
| Louisville | Kentucky | 621,349 | Permit | Weak | No | 37 |
| Baltimore | Maryland | 611,648 | Permit | Medium | Lobby | 22 |
| Milwaukee | Wisconsin | 595,351 | Restricted | Medium | Strong | 35 |
| Fresno | California | 527,438 | Restricted | Weak | Lobby | 45 |
| Sacramento | California | 501,901 | Restricted | Weak | No | 22 |
| Kansas City | Missouri | 488,943 | Restricted | Strong | Lobby | 38 |
| Atlanta | Georgia | 486,290 | Restricted | Weak | Lobby | 17 |
| Long Beach | California | 469,450 | Restricted | Weak | Lobby | 12 |
| Raleigh | North Carolina | 464,758 | Permit | Weak | Strong | 37 |
| Colorado Springs | Colorado | 464,474 | Restricted | Weak | Lobby | 25 |
| Miami | Florida | 463,347 | Medallion | Strong | Strong | 39 |
| Virginia Beach | Virginia | 450,435 | Restricted | Weak | No | 37 |
| Oakland | California | 425,195 | Medallion | Weak | No | 26 |
| Minneapolis | Minnesota | 422,331 | Restricted | Weak | No | 19 |
| Tulsa | Oklahoma | 401,800 | Permit | Medium | No | 36 |
| Arlington | Texas | 396,394 | Restricted | Weak | Strong | 30 |
| New Orleans | Louisiana | 393,292 | Medallion | Strong | Strong | 49 |
| Wichita | Kansas | 390,591 | Permit | Weak | No | 41 |
| Cleveland | Ohio | 385,525 | Permit | Medium | No | 37 |
| Tampa | Florida | 385,430 | Restricted | Strong | Strong | 37 |
| Honolulu | Hawaii | 350,395 | Restricted | Strong | Lobby | 29 |
| Corpus Christi | Texas | 325,605 | Permit | Strong | No | 39 |
| Lexington | Kentucky | 321,959 | Permit | Weak | No | 39 |
| St. Louis | Missouri | 308,626 | Restricted | Strong | Strong | 37 |
| St. Paul | Minnesota | 306,621 | Permit | Weak | No | 19 |
| Cincinnati | Ohio | 301,301 | Restricted | Medium | Strong | 36 |
| Anchorage | Alaska | 294,356 | Medallion | Strong | Strong | 43 |
| Greensboro | North Carolina | 290,222 | Permit | Weak | No | 39 |
| Newark | New Jersey | 285,154 | Medallion | Strong | Strong | 32 |
| Orlando | Florida | 280,257 | Permit | Strong | Lobby | 39 |
| Toledo | Ohio | 276,491 | Permit | Weak | No | 37 |
| Jersey City | New Jersey | 270,753 | Medallion | Weak | No | 32 |
| Durham | North Carolina | 267,743 | Permit | Weak | No | 38 |
| St. Petersburg | Florida | 263,255 | Permit | Medium | Lobby | 37 |
| Laredo | Texas | 260,654 | Permit | Strong | No | 72 |
| Buffalo | New York | 258,612 | Permit | Weak | No | 37 |
| Madison | Wisconsin | 255,214 | Restricted | Strong | Lobby | 36 |
| Lubbock | Texas | 253,888 | Permit | Medium | Lobby | 39 |
| Norfolk | Virginia | 244,703 | Permit | Weak | No | 37 |
| Winston-Salem | North Carolina | 244,605 | Permit | Weak | No | 39 |
| Boise | Idaho | 226,570 | Permit | Medium | No | 43 |
| Baton Rouge | Louisiana | 225,374 | Permit | Weak | Lobby | 40 |
| Des Moines | Iowa | 217,521 | Restricted | Weak | No | 42 |
| Spokane | Washington | 217,108 | Permit | Medium | Lobby | 37 |
| Tacoma | Washington | 213,418 | Permit | Medium | No | 37 |
| Birmingham | Alabama | 210,710 | Permit | Medium | No | 57 |
| Fayetteville | North Carolina | 209,889 | Permit | Weak | No | 39 |
| Rochester | New York | 208,046 | Permit | Medium | Strong | 37 |
| Salt Lake City | Utah | 200,544 | Permit | Medium | No | 37 |
| Amarillo | Texas | 199,826 | Permit | Weak | No | 40 |
| Montgomery | Alabama | 199,518 | Permit | Weak | No | 58 |
Online Appendix 2. OLS Model Specification

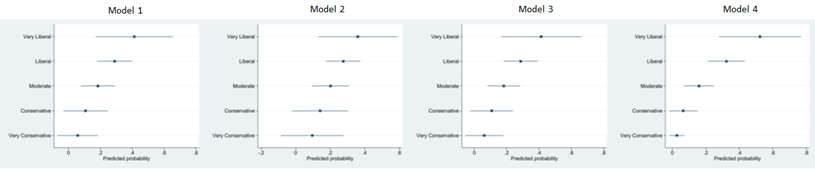
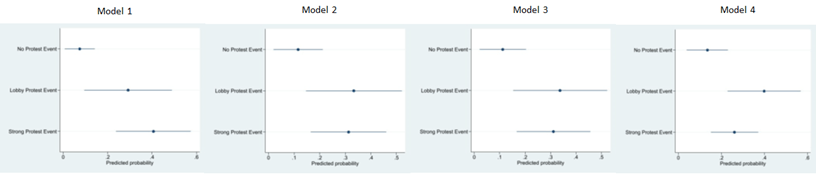
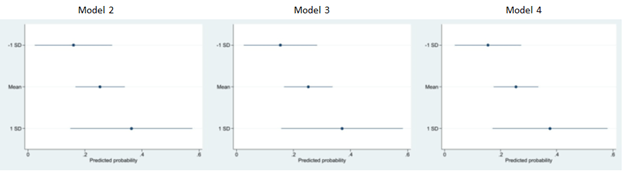
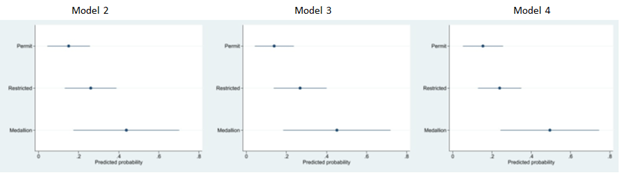
Online Appendix 3. Predicted Probabilities for Select Variables of Their Impact on Cities’ Likelihood of Taking a Strong Regulatory Response (Response = 3) to TNCs for all Models.
City Ideology
Protest
Taxi Jobs Per 1,000
Pre-Uber Environment
Months from Uber Launch

